


[Market Updates] 2026 Quarter 2

In the blink of an eye, we’ve entered the third quarter of 2026. In this article, I’ll do a rundown on
what has happened during the second quarter of 2026
a. The Iran Conflict Flip-Flop
This is going to be a long ass update, so buckle up.
You can jump to the different sections that interest you, but if this is the one article you read per quarter to bring yourself up to speed on the markets, read through everything.
1. What Has Happened During 2Q 2026
1a. The Iran Conflict Flip-Flop
Given the volatility of the battlefield coupled with the flip-flop of the Trump administration, I think it’s better to explain the developments of the conflict on a month-by-month basis.
April: A ceasefire that never quite held
The war began on 28 February 2026, when the United States and Israel launched strikes on Iran. On 8 April, after more than five weeks of fighting, the US and Iran agreed to a two-week ceasefire brokered by Pakistan. The relief was immediate but short-lived. Within hours, fighting flared in neighbouring Lebanon, and the two sides accused each other of breaking the terms.
The central dispute was the Strait of Hormuz: the US insisted the waterway be reopened, Iran refused to do so while a US naval blockade of its ports remained in place. On 21 April, President Trump extended the ceasefire “indefinitely” while leaving the blockade in force. In practice, neither side removed its blockade, oil kept struggling to move, and low-level strikes continued. Direct talks between the two governments on 11–12 April - the highest-level contact since 1979 - ended without agreement.
May: Hopes raised, then dashed
May followed the same pattern of optimism colliding with reality. Around 23–24 May, President Trump announced that a deal to reopen the strait was “largely negotiated” and would be announced shortly; oil prices fell and shares rose on the news. But Iran quickly pushed back, with its own agencies calling the announcement “incomplete and inconsistent with reality” and insisting the strait would stay under Iranian control.
The month closed on a sharply worse note: on 1 June, reflecting the end of May, Iranian state media announced Tehran would stop all communication with the US and move to completely block the Strait of Hormuz in retaliation for continued fighting. Oil prices jumped more than 7% in a single day. After roughly three months of war, a diplomatic solution looked further away than ever.
June: A signed deal, and then more strikes
June brought the closest thing yet to a resolution - and then promptly tested it. Around 11 to 15 June the two sides reached an initial agreement, and on 17 June Presidents Trump and Pezeshkian signed a formal “memorandum of understanding” to end the war. It set a 60-day window to negotiate final terms, including reopening the strait.
Markets cheered: the day the deal was announced, the US stock market rose about 1.9% and oil fell almost 5%. But the hardest issues — Iran's nuclear programme, frozen Iranian funds, and the fighting in Lebanon — were left unresolved.
By the final week of June, the ceasefire was breaking down again. After an Iranian drone struck a tanker, the US carried out fresh strikes on 26 to 28 June; Iran retaliated by firing missiles and drones at US bases in Kuwait and Bahrain. President Trump warned that Iran “will no longer exist” if attacks continued, while Iran threatened to halt talks entirely. As this update goes out, a signed deal is technically in place, but both sides are still trading fire.
What this means for you
Energy-driven inflation is the real link. The war's main effect on your portfolio is through fuel prices, which have kept inflation high and complicated the path for interest rates
Volatility, not direction. The repeated cycle of “deal on, deal off” has produced sharp daily swings in oil and shares. A diversified portfolio is designed to absorb exactly this kind of headline-driven noise without you needing to react to each twist.
Watch the strait, not the rhetoric. The single most important practical question is whether oil can move freely through the Strait of Hormuz. Until shipping there is reliably back to normal, expect continued price swings.

While the price of Oil has came back down drastically from its all-time high, what has yet to recover is the actual plumbing output itself. At the moment, Gulf exports are only at roughly 75% of prewar levels, hundreds of vessels are still stranded, and the strait is "open, but mined, half-empty, and subject to tolls."
So, while the financial prices of oil have given the global economy a breather, the supply normalization that brought prices down is fragile and incomplete. The price reflects optimism about a deal that, as of this weekend, both sides are still actively violating and may be at risk of reversing should the situation worsen yet again.
1b. New Head Of The Federal Reserve
From good afternoon to good day, on 22 May 2026, Kevin Warsh was sworn in and chaired his first policy meeting in June having replaced Jerome Powell, who had previously led the Fed since 2018.
Immediately, it is apparent that things will not be the same as before with new leadership, and we can expect the Federal Reserve to be more reserved (no pun intended) with their future communications:
| Jerome Powell (2018–2026) | Kevin Warsh (from May 2026) |
Overall leaning | Pragmatic; cut rates through late 2025 | Hawkish; focused on crushing inflation |
Forward guidance | Gave markets advance signals | Opposes it; removed it from statements |
The “dot plot” | Used and participated | Kept it, but declined to submit his own dot; may phase it out |
Policy statement | Longer, detailed | Shorter, stripped-down |
Communication style | Predictable, telegraphed | Less guidance; potentially more market surprises |
On AI and inflation | Saw AI spending as real growth | Argues AI will eventually lower inflation |
Outside of his personal hawkish stance and leadership preferences, given the current inflationary environment (led by the disruptions in the Iran conflict and shortages of memory chips), it is likely that the Federal Reserve will remain hawkish in the coming months, with the June Dot Plot signalling that officials are expected to either hold rates steady or potentially raise them further.

What this means for you
Borrowing stays expensive for now. With cuts off the table and a hike possible, the cost of borrowing is expected to remain at its current levels or increase further, thereby eroding the net profitability of businesses.
Higher rates can pressure share prices. When rates are expected to stay high, fast-growing companies — technology especially — can see their share prices fall, because future profits are worth less in today's money.
Expect sharper reactions to Fed meetings. With less advance guidance, markets may jump more around each announcement. Again, this is noise a diversified plan is built to ride out.
1c. Gold Record Reversal
Given the sheer amount of retail investor interest in gold due to its spectacular performance over 2024 and 2025, one may have questioned whether the instrument that thrives on uncertainty has been broken after witnessing the dramatic decline (-28% peak to trough) in gold prices in a time where global uncertainty has reached an all-time high.

For those who had hopped into the hype, here’s my hypothesis and guess as to what is going on.
In my opinion, the key to the puzzle is understanding what gold actually competes with. Gold pays you nothing - no interest, no dividend. Its main rival is safe government bonds, which do pay interest.
The crucial comparison is the bond return after inflation (often called the “real” return). When that real return is low or negative, gold looks attractive, because you’re not giving up much income to hold it. When that real return rises, gold becomes expensive to hold as every dollar in gold is a dollar not earning a now-meaningful return in bonds. That trade-off, the income you give up by choosing gold, is the single biggest driver of its price.
Now follow what the war set in motion on oil prices (expanded on point 1a), a higher oil fed straight into inflation with energy costs rose around 23.5% over the year and accounting for more than 60% of one month’s entire inflation increase.
Higher inflation killed off any expectation that the US Federal Reserve (the Fed, America’s central bank) would cut interest rates. Instead, under its new chairman, the Fed turned firmly toward keeping rates high, with markets now expecting possible rate increases this year (expanded on point 1b). High rates and stubborn inflation meant bond returns climbed, and the US dollar strengthened.
That combination of better returns available elsewhere and a stronger dollar is precisely the environment in which gold struggles.
So, the war did raise some demand for gold as a safe haven, but that was overwhelmed by the bigger force it unleashed: higher expected rates. In short, gold’s real enemy is no danger in the world; it is high interest rates.
This war happened to produce exactly that.
As I do not recommend any gold exposure in our portfolio, I will not be expanding on how the development of gold prices would affect our equity portfolio given that the link between these two instruments is very weak to begin with.
2. Making Sense of Market Price Actions

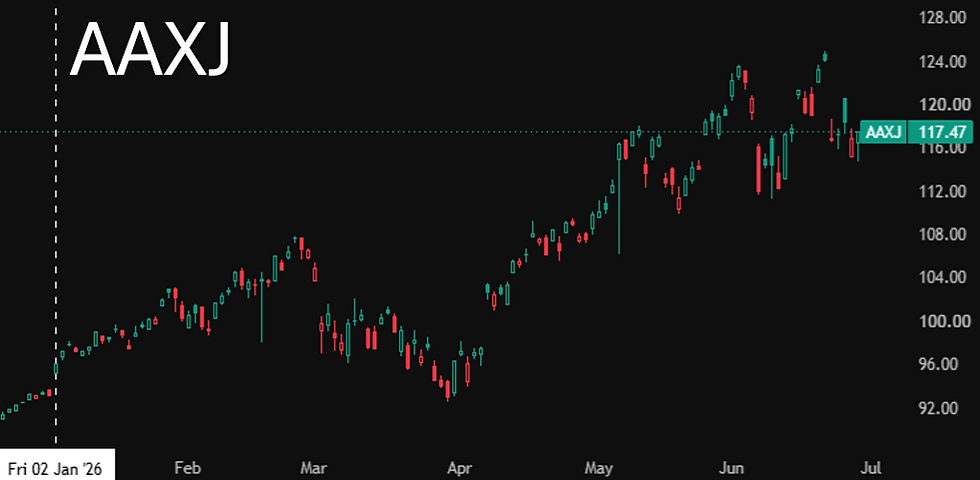
Year to date, the markets returned a return of:
Global markets (represented by S&P): 9.33%
Asia ex Japan (represented by MSCI AAXJ): 28.13%
Looking at the price performances of the past 6 months, here’s my take on what has moved the markets:
January to February – Divergence.
Coming off another strong year and sitting at elevated valuations, the S&P 500 had little room to run and moved sideways, consolidating rather than extending its gains.
Asia ex-Japan, by contrast, continued its recovery, helped by two tailwinds the US lacked: growing investor appetite to diversify away from expensive Western markets, and materially cheaper valuations relative to developed markets. In short, the US was digesting past gains while Asia was still repricing higher from a lower base.
March to April – The War Scare & Reversal.
In March, the market priced in the Iran conflict directly and equities sold off hard, with both the S&P and AAXJ bottoming near their April low as investors braced for an oil-driven inflation shock and the higher-for-longer interest rates that would follow. Then it reversed just as sharply, and the reason is the important part.
The rebound was not driven by the war resolving; the conflict remained unresolved and oil stayed elevated. Three things turned it.
First, the market had fallen into April deeply oversold and lightly positioned, meaning much of the selling was already done and it took only a pause in the bad news to spark a bounce.
Second, war headlines stopped worsening and began to stabilize, which was enough to shift a fearful, hedged market back to risk-taking.
Third, and most powerfully, an exceptionally strong Q1 earnings season landed at exactly that moment — with S&P 500 earnings tracking their fastest growth in years and running well above expectations — giving investors a fundamental reason to buy that had nothing to do with the Middle East.

Crucially, technology led the rebound out of all proportion to its size (roughly 57% of the recovery from a sector that is about a third of the index), because tech is relatively insulated from an oil shock and was where earnings momentum was concentrated.
So the recovery was real, but it was narrow, and it planted the seed for the next leg.
May to June: the AI and semiconductor melt-up, then a wobble.
The final leg of the first half was carried by enthusiasm for AI and semiconductors, which drove the S&P 500 to fresh record highs above 7,600 by early June. This was a continuation of April's narrow leadership: a handful of chip and AI-related names did the heavy lifting while the broader market participated far less.
That narrowness cut both ways. The same concentration that powered the index to new highs left it exposed when sentiment turned, and in the final weeks of June an "AI bubble" scare — compounded by the prospect of rate hikes from a newly hawkish Fed — triggered a sharp pullback that pulled the index back off its peak, which is where the chart ends the half.
Asia ex-Japan tracked a similar arc, grinding to new highs on the same AI and semiconductor demand (Korea and Taiwan chipmakers especially) before giving back in the June sell-off.
Two threads tie the half together: the market's gains became increasingly dependent on a narrow set of AI and semiconductor names as the year progressed, and the biggest moves in both directions were driven not by the war itself but by the interest-rate expectations that flowed from it.
Given how dependent both the market and global economy is on the AI developments today, I’ve also done a deep dive on the current situation on a separate article to bring yall up to date as to the current situation.
You can read more about it here: Artificial Intelligence & The Market: What's the Situation Today
3. Moving Forward: What Should We Do
The honest answer is that no one knows where the market goes from here, and if you've read this far, you'll notice that every major move this half was driven by something almost no one predicted in January.
That's the point: trying to time the market is a losing game. What you can control is matching your decisions to your own circumstances, not to the headlines. So rather than asking "what will the market do?", ask two questions about yourself.
First: when do you need this money? And second: where are you in your journey?
Your answers place you in one of three situations.
If you're early in your wealth-accumulation journey, say five to ten years into a twenty-to-twenty-five-year plan for a goal like retirement, and you don't need these funds any time soon, then stay invested and do nothing.
This is the most important message in this letter, so let me be blunt about why. At this stage, your total invested amount is still small relative to what it will eventually become, and the contributions you'll make in the years ahead dwarf your current balance. Whether the market is up or down this year barely moves the needle on your outcome.
Actively taking profits or "de-risking" now doesn't protect you; it just risks locking in a lower long-term return and interrupting the compounding that does the real work. Volatility is not your enemy here; it's the entry price for the returns you're investing for in the first place.
If you've already accumulated a sizeable portfolio and you're approaching your retirement target, the calculus changes. Now the priority shifts from growing the pot to protecting it, because a large loss late in the journey is far harder to recover from than an early one.
This is the point at which it makes sense to take some profit, rebalance, and gradually position the portfolio for retirement — trimming risk deliberately so that a downturn just before you need the money doesn't derail your plans. This is not a reaction to the current market; it's a planned transition that would make sense regardless of what markets were doing.
If you have a specific, near-term use for these funds (i.e. a home down-payment in two years) then money you'll need soon shouldn't be exposed to this kind of short-term volatility, full stop.
Here it may well make sense to take profit and move those funds somewhere safer, so that a bad six months doesn't arrive at exactly the wrong time. Money with a job to do in the near future belongs somewhere its value is more certain.
The common thread: the right move depends on your timeline and your needs, not on whether the market feels frightening or euphoric this quarter.
If you're not sure which situation applies to you or your circumstances have changed since we last spoke, that's exactly the conversation to have at your next annual review. As usual, if you have any questions, just PM me.
Daniel is a Licensed Financial Consultant with MAS and a Certified Financial Planner (CFP®).
Connect with me on social media platforms to receive updates on future content! You can also slide into my DMs if you have any questions :)


Disclaimer:
This article is meant to be the opinion of the author
This article is for information purposes only
This article should not be seen as financial advice
This advertisement has not been reviewed by the Monetary Authority of Singapore


![Is CDL Hospitality Trust A Good Buy In 2026? [Fundamental Analysis]](https://static.wixstatic.com/media/5dc7f7_90cdc9cecbde4d28b3df8b22215a37eb~mv2.png/v1/fill/w_1277,h_720,fp_0.50_0.50,q_35,blur_30,enc_avif,quality_auto/5dc7f7_90cdc9cecbde4d28b3df8b22215a37eb~mv2.png)
![Is CDL Hospitality Trust A Good Buy In 2026? [Fundamental Analysis]](https://static.wixstatic.com/media/5dc7f7_90cdc9cecbde4d28b3df8b22215a37eb~mv2.png/v1/fill/w_972,h_548,fp_0.50_0.50,q_95,enc_avif,quality_auto/5dc7f7_90cdc9cecbde4d28b3df8b22215a37eb~mv2.png)
![Is Far East Hospitality Trust A Good Buy In 2026? [Fundamental Analysis]](https://static.wixstatic.com/media/5dc7f7_e3045957630c4cd6aa0f4796641f22d7~mv2.png/v1/fill/w_1277,h_720,fp_0.50_0.50,q_35,blur_30,enc_avif,quality_auto/5dc7f7_e3045957630c4cd6aa0f4796641f22d7~mv2.png)
![Is Far East Hospitality Trust A Good Buy In 2026? [Fundamental Analysis]](https://static.wixstatic.com/media/5dc7f7_e3045957630c4cd6aa0f4796641f22d7~mv2.png/v1/fill/w_972,h_548,fp_0.50_0.50,q_95,enc_avif,quality_auto/5dc7f7_e3045957630c4cd6aa0f4796641f22d7~mv2.png)
Comments